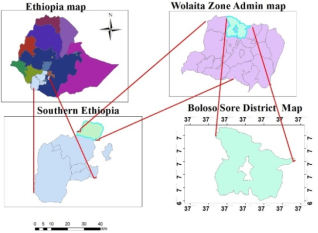
Performance evaluation of irrigation scheme is vital for realizing the present status and identifying the area for improvement. The study was conducted in Woybo irrigation scheme which is located in Boloso Sore district, Wolaita zone, Southern Ethiopia. This study was aimed to evaluate the performance of Woybo irrigation scheme with internal performance indicators. A total of nine demonstrating farmers' fields were selected from three canal reaches (head, middle, and tail) through purposive sampling. Primary and secondary data were collected, recorded, and analyzed. To measure the water applied to each experimental field, Parshall flume was installed, and soil samples were taken to determine soil texture, field capacity, permanent wilting point, and soil moisture content before and after each irrigation event at regular soil depth intervals. The results revealed that the mean conveyance efficiency was 60.85% and the application efficiency was 48.53%. Water distribution uniformity, deep percolation, and storage efficiencies were 84.56%, 51.47%, and 85.22%, respectively. However, the overall irrigation efficiency was found to be 29.53%, which was poorly performed due to inadequate water application, ineffective field water management, and low efficiency in water delivery systems. The main factors contributing to the poor water delivery performance included failures in water regulating gates, leakages, and siltation of canals. To address these problems, recommendations are made such as improvements in water application techniques should be implemented, through proper irrigation scheduling, water conservation practices, surge irrigation techniques, and providing extension support, training, and experience sharing. Additionally, maintenance and lining of earthen canals are necessary, along with the replacement and repair of leakages and broken water regulating and controlling structures. These measures can help to upgrade water delivery efficiency and improve the overall performance of the irrigation scheme.
| Published in | American Journal of Water Science and Engineering (Volume 10, Issue 3) |
| DOI | 10.11648/j.ajwse.20241003.13 |
| Page(s) | 64-73 |
| Creative Commons |
This is an Open Access article, distributed under the terms of the Creative Commons Attribution 4.0 International License (http://creativecommons.org/licenses/by/4.0/), which permits unrestricted use, distribution and reproduction in any medium or format, provided the original work is properly cited. |
| Copyright |
Copyright © The Author(s), 2024. Published by Science Publishing Group |
Efficiency, Evaluation, Internal Indicators, Irrigation Scheme and Performance
Canal location | Soil depth (cm) | Bulk density g/cm3 | Particle size distribution (%) | Textural class | ||
|---|---|---|---|---|---|---|
Sand | Clay | Silt | ||||
Head | 0-30 | 1.10 | 30 | 52 | 18 | Clay |
30-60 | 1.16 | 26 | 44 | 30 | Clay | |
60-90 | 1.22 | 28 | 48 | 24 | Clay | |
90-120 | 1.26 | 22 | 48 | 30 | Clay | |
mean | 1.19 | |||||
Middle | 0-30 | 1.08 | 24 | 40 | 36 | Clay |
30-60 | 1.18 | 26 | 42 | 32 | Clay | |
60-90 | 1.19 | 20 | 52 | 28 | Clay | |
90-120 | 1.21 | 38 | 42 | 20 | Clay | |
mean | 1.16 | |||||
Tail | 0-30 | 1.11 | 24 | 44 | 33 | Clay |
30-60 | 1.09 | 22 | 42 | 34 | Clay | |
60-90 | 1.17 | 14 | 42 | 44 | Silt clay | |
90-120 | 1.19 | 18 | 28 | 54 | Silt clay loam | |
mean | 1.14 | |||||
Overall mean | 1.16 | 26 | 42 | 32 | Clay | |
Location | Soil depth (cm) | Soil physical properties (v/v), % | TAW (%) (v/v) | TAW (mm) | |
|---|---|---|---|---|---|
|
| ||||
Head | 0-30 | 41.24 | 27.2 | 14.04 | 42.12 |
30-60 | 36.16 | 24.7 | 11.46 | 34.38 | |
60-90 | 38.7 | 24.5 | 10.15 | 30.45 | |
90-120 | 37.1 | 22.3 | 14.8 | 44.4 | |
Total | 151.35 | ||||
Middle | 0-30 | 37.0 | 23.2 | 13.8 | 41.4 |
30-60 | 37.7 | 23.0 | 14.7 | 44.1 | |
60-90 | 35.1 | 22.3 | 12.8 | 38.4 | |
90-120 | 36.8 | 23.2 | 13.6 | 40.8 | |
Total | 164.7 | ||||
Tail | 0-30 | 39.1 | 22.8 | 16.3 | 48.9 |
30-60 | 37.1 | 22.3 | 14.8 | 44.4 | |
60-90 | 36.65 | 23.8 | 12.85 | 38.55 | |
90-120 | 33.5 | 21.9 | 11.6 | 34.8 | |
Total | 166.65 | ||||
Overall mean value | 160.9 | ||||
Canal section | Conveyance efficiency,% | Water Loss,% | Water loss (l/s) /100m |
|---|---|---|---|
Main canals | 83.38 | 16.62 | 4.05 |
Secondary canals | 72.92 | 27.08 | 3.18 |
Scheme efficiency,% | 60.80 |
Field location | Applied depth (mm) | Stored water (mm) | Efficiency (Ea, %) |
|---|---|---|---|
Head | 130.88 | 60.87 | 46.51 |
Middle | 106.84 | 50.94 | 47.68 |
Tail | 114.47 | 58.85 | 51.41 |
Scheme efficiency (%) | 48.53 | ||
Field location | Stored water (mm) | Required water (mm) | Storage efficiency (Es, %) |
|---|---|---|---|
Head | 60.87 | 66.44 | 91.61 |
Middle | 50.94 | 59.23 | 86.00 |
Tail | 58.85 | 75.4 | 78.05 |
Scheme Storage Efficiency (Es, %) | 85.22 | ||
Field location | Mean stored water (mm) | Least quarter mean stored water (mm) | DU, % |
|---|---|---|---|
Head | 59.21 | 50.08 | 84.58 |
Middle | 58.27 | 48.6 | 83.4 |
Tail | 52.51 | 45.0 | 85.7 |
Scheme DU (%) | 84.56 | ||
Field location | Application Efficiency,% | Runoff ratio,% | DPR (%) |
|---|---|---|---|
Head | 46.50 | 0 | 53.50 |
Middle | 47.67 | 0 | 52.33 |
Tail | 51.41 | 0 | 48.59 |
Scheme efficiency | 48.53 | 51.47 |
Internal indicators | Efficiency (%) |
|---|---|
Conveyance efficiency | 60.85 |
Application efficiency | 48.53 |
Storage efficiency | 85.22 |
Distribution efficiency | 84.56 |
Deep Percolation ratio | 51.47 |
Overall efficiency | 29.53 |
| [1] | Belete B., Seleshi, Y., Melesse, A. Surface Water and Groundwater Resources of Ethiopia: Potentials and Challenges of Water Resources Development. Springer, Cham. |
| [2] | Ayalew DW. Theoretical and Empirical Review of Ethiopian Water Resource Potentials, Challenges and Future Development Opportunities. International Journal of Waste Resources, 2018, 08(04). |
| [3] | Seleshi Bekele, Teklu Erkossa and Regassa E. Namara. Irrigation potential in Ethiopia. Constraints and opportunities for enhancing the system. International Water Management Institute. 2010b. |
| [4] | Jibril, G.., Saidu, M, and Yabagi, A. A. Performance evaluation of Badeggi irrigation scheme, Niger State Nigeria, using efficiency techniques. Scholarly Journal of Science Research and Essay, 2017. Vol. 6(2): pp 42-47. |
| [5] | Fissahaye DY, Ritsema CJ, Solomon H. Irrigation water management: Farmers practices, perceptions and adaptations at Gumselassa irrigation scheme, North Ethiopia. Agricultural Water Management 2017, 191: 16-28. |
| [6] | FAO. Guidelines for Designing and Evaluating Surface Irrigation System. Irrigation and drainage paper No. 45. Rome, 1989. |
| [7] | Serawit Gensa. Technical performance evaluation of irrigation scheme at Boloso sore district, Southern Ethiopia. Civil and Environmental Research. 2023. Vol. 15 (2). P12-20. |
| [8] | WZFEDD. Wolaita Zone finance and economic development department. Statistical and Geo-spatial data system administration directorate annual statistical abstract, Wolaita Sodo, Ethiopia. 2022. |
| [9] | Allen, R. G., L. S. Pereira, D. Raes and M. Smith. Crop Evapotranspiration: Guidelines for Computing Crop Requirements. FAO Irrigation and Drainage paper No. 56, 1998, Rome. |
| [10] | Bouyoucos, G. H. A Recalibration of the Hydrometer Method for Making Mechanical Analysis of Soils. Agronomy Journals, 1951, 43, 434-438. |
| [11] | Jaiswal, P. C. Soil, Plant and Water Analyses. Ludhiana Kalyani publishers. New Delhi, India. 2003. |
| [12] | WR Walker, V Gaylord, Skogerboe. Surface Irrigation, Theory and Practice. Prentice Hall, New Jersey 1987. |
| [13] | FAO. Irrigation water management training manual No-7, Rome, Italy, 1993. |
| [14] | Harrelson, C. C., Rawlins, C. L. and Potyondy, John P. Stream channel reference sites: an illustrated guide to field technique. Gen. Tech. Rep. RM-245. Fort Collins, CO: U. S. Department of Agriculture, Forest Service, Rocky Mountain Forest and Range Experiment Station, ILRI, Netherlands 1994, 61p. |
| [15] | Michael, A. Irrigation Theory and Practice. 2nd Edition, VIKA publishing house Pvt. Ltd. New Delhi, India. 2008. |
| [16] | Garg S. K. Irrigation engineering and Hydraulic structures. 9th edition. Khanna Publishers. New Delhi, India. 2005 |
| [17] | Irmak, Suat; Odhiambo, Lameck O.; Kranz, William L.; and Eisenhauer, Dean E., "Irrigation Efficiency and Uniformity, and Crop Water Use Efficiency". Biological Systems Engineering: Papers and Publications. 2011, 451. |
| [18] | Feyen, Jan. and Dawit Zerihun. Assessment of the performance of border and furrow Irrigation Systems and the Relationship between Performance Indicators and system Variables, Agricultural Water Management, Elsevier. 1999. Vol. 40 (2-3): pp 353 – 362. |
| [19] | Miller, W. R. and R. L. Donahue, Soils in our environment. 7th ed. Prentice Hall Inc, New Jersey. 649p. 1995. |
| [20] | Savva, A. and K. Frenken, Planning, Development Monitoring and Evaluation of Irrigated Agriculture with Farmer Participation. FAO, Harare, 2002. |
| [21] | Muhammedziyad Geleto, Mihret Dananto and Demisachew Tadele. Performance evaluation of selected surface irrigation schemes in Kacha Bira Woreda, SNNPRS, Ethiopia, Applied Research Journal of Environmental Engineering, 2019. 15: 6-25. Article number: se-j-arjee-2018.0101001. |
| [22] | Henok Tesfaye and Kedir Jemal. Technical Performance Evaluation of Small-Scale Irrigation Scheme at Wondo Genet, Ethiopia. American Journal of Science, Engineering and Technology. Vol. 5, No. 4, 2020, pp. 141-147. |
| [23] | Ayele Tebikew. Technical Performance Evaluation and Redesigning of Small-Scale Irrigation Scheme: Case of Guder Irrigation Scheme Awi Zone, Amhara Region. MSc. Thesis. Haramaya University, 2016. |
| [24] | Raghuwanshi, `N. S. and Wallender, W. Optimal Furrow Irrigation Scheduling under Heterogeneous Conditions, Agricultural Systems, 1998, Vol 56 (1): pp35-39. |
| [25] | Eticha shiberu. Performance Evaluation of Small scale Irrigation Schemes in Adami Tullu Jido Kombolcha Woreda, Central Rift Valley of Ethiopia. Msc Thesis. Haramay University, 2011. |
APA Style
Gensa, S., Woldemichael, A., Zewdie, M. (2024). Performance Evaluation of Woybo Irrigation Scheme: Wolaita Zone, Southern Ethiopia. American Journal of Water Science and Engineering, 10(3), 64-73. https://doi.org/10.11648/j.ajwse.20241003.13
ACS Style
Gensa, S.; Woldemichael, A.; Zewdie, M. Performance Evaluation of Woybo Irrigation Scheme: Wolaita Zone, Southern Ethiopia. Am. J. Water Sci. Eng. 2024, 10(3), 64-73. doi: 10.11648/j.ajwse.20241003.13
AMA Style
Gensa S, Woldemichael A, Zewdie M. Performance Evaluation of Woybo Irrigation Scheme: Wolaita Zone, Southern Ethiopia. Am J Water Sci Eng. 2024;10(3):64-73. doi: 10.11648/j.ajwse.20241003.13
@article{10.11648/j.ajwse.20241003.13,
  author = {Serawit Gensa and Abraham Woldemichael and Moltot Zewdie},
  title = {Performance Evaluation of Woybo Irrigation Scheme: Wolaita Zone, Southern Ethiopia
},
  journal = {American Journal of Water Science and Engineering},
  volume = {10},
  number = {3},
  pages = {64-73},
  doi = {10.11648/j.ajwse.20241003.13},
  url = {https://doi.org/10.11648/j.ajwse.20241003.13},
  eprint = {https://article.sciencepublishinggroup.com/pdf/10.11648.j.ajwse.20241003.13},
  abstract = {Performance evaluation of irrigation scheme is vital for realizing the present status and identifying the area for improvement. The study was conducted in Woybo irrigation scheme which is located in Boloso Sore district, Wolaita zone, Southern Ethiopia. This study was aimed to evaluate the performance of Woybo irrigation scheme with internal performance indicators. A total of nine demonstrating farmers' fields were selected from three canal reaches (head, middle, and tail) through purposive sampling. Primary and secondary data were collected, recorded, and analyzed. To measure the water applied to each experimental field, Parshall flume was installed, and soil samples were taken to determine soil texture, field capacity, permanent wilting point, and soil moisture content before and after each irrigation event at regular soil depth intervals. The results revealed that the mean conveyance efficiency was 60.85% and the application efficiency was 48.53%. Water distribution uniformity, deep percolation, and storage efficiencies were 84.56%, 51.47%, and 85.22%, respectively. However, the overall irrigation efficiency was found to be 29.53%, which was poorly performed due to inadequate water application, ineffective field water management, and low efficiency in water delivery systems. The main factors contributing to the poor water delivery performance included failures in water regulating gates, leakages, and siltation of canals. To address these problems, recommendations are made such as improvements in water application techniques should be implemented, through proper irrigation scheduling, water conservation practices, surge irrigation techniques, and providing extension support, training, and experience sharing. Additionally, maintenance and lining of earthen canals are necessary, along with the replacement and repair of leakages and broken water regulating and controlling structures. These measures can help to upgrade water delivery efficiency and improve the overall performance of the irrigation scheme.
},
 year = {2024}
}
TY  - JOUR
T1  - Performance Evaluation of Woybo Irrigation Scheme: Wolaita Zone, Southern Ethiopia

AU  - Serawit Gensa
AU  - Abraham Woldemichael
AU  - Moltot Zewdie
Y1  - 2024/09/20
PY  - 2024
N1  - https://doi.org/10.11648/j.ajwse.20241003.13
DO  - 10.11648/j.ajwse.20241003.13
T2  - American Journal of Water Science and Engineering
JF  - American Journal of Water Science and Engineering
JO  - American Journal of Water Science and Engineering
SP  - 64
EP  - 73
PB  - Science Publishing Group
SN  - 2575-1875
UR  - https://doi.org/10.11648/j.ajwse.20241003.13
AB  - Performance evaluation of irrigation scheme is vital for realizing the present status and identifying the area for improvement. The study was conducted in Woybo irrigation scheme which is located in Boloso Sore district, Wolaita zone, Southern Ethiopia. This study was aimed to evaluate the performance of Woybo irrigation scheme with internal performance indicators. A total of nine demonstrating farmers' fields were selected from three canal reaches (head, middle, and tail) through purposive sampling. Primary and secondary data were collected, recorded, and analyzed. To measure the water applied to each experimental field, Parshall flume was installed, and soil samples were taken to determine soil texture, field capacity, permanent wilting point, and soil moisture content before and after each irrigation event at regular soil depth intervals. The results revealed that the mean conveyance efficiency was 60.85% and the application efficiency was 48.53%. Water distribution uniformity, deep percolation, and storage efficiencies were 84.56%, 51.47%, and 85.22%, respectively. However, the overall irrigation efficiency was found to be 29.53%, which was poorly performed due to inadequate water application, ineffective field water management, and low efficiency in water delivery systems. The main factors contributing to the poor water delivery performance included failures in water regulating gates, leakages, and siltation of canals. To address these problems, recommendations are made such as improvements in water application techniques should be implemented, through proper irrigation scheduling, water conservation practices, surge irrigation techniques, and providing extension support, training, and experience sharing. Additionally, maintenance and lining of earthen canals are necessary, along with the replacement and repair of leakages and broken water regulating and controlling structures. These measures can help to upgrade water delivery efficiency and improve the overall performance of the irrigation scheme.

VL  - 10
IS  - 3
ER  -
Department of Irrigation and Drainage, Wolaita Sodo Agricultural College, Wolaita Sodo, Ethiopia
Department of Water Resource and Irrigation Engineering, Institute of Technology, Hawassa University, Hawassa, Ethiopia
Department of Water Resource and Irrigation Engineering, Institute of Technology, Hawassa University, Hawassa, Ethiopia